

How to read stock charts and market indicators using a share market app
Mail This Article


Stock charts and market indicators help investors and traders understand how share prices have moved over a period of time. They provide information about price trends, trading volumes and market activity, which can be useful when studying a stock. Many share market apps now include stock charting functionality and indicators so you can easily view this data on your phone. There are many factors to take into consideration when trying to read stock charts. We will break down how to read stock charts and market indicators on a share market app in this article.
What are stock charts? What are stock charts?
A stock chart displays the price movement for a stock over a specific period of time. It shows how the price has changed during a particular timeframe, such as a day, week, month or year.
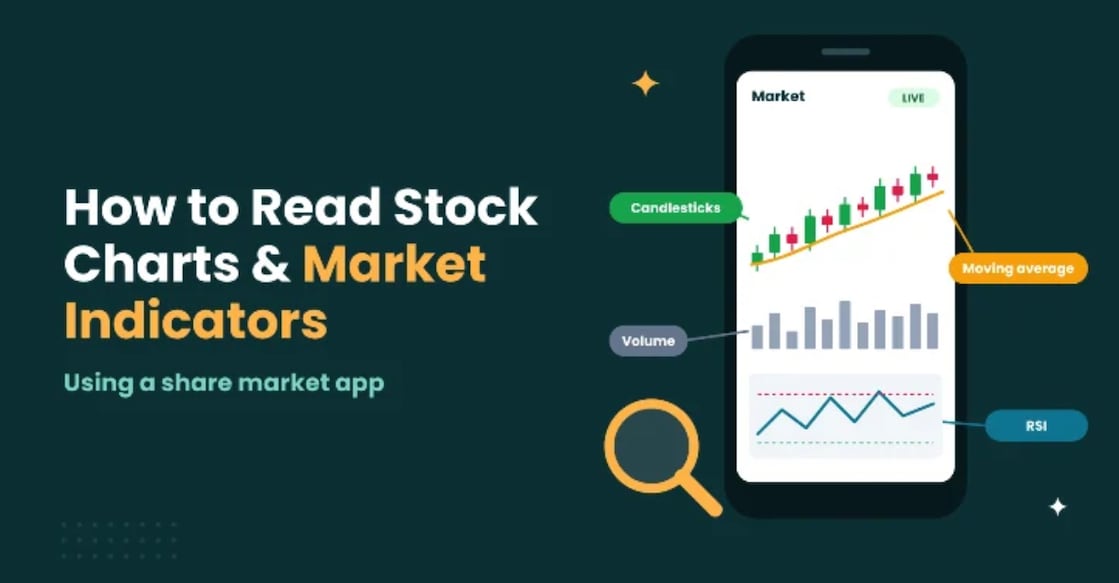
Usually, share market apps provide multiple types of charts, including Line Charts, Bar Charts and Candlestick Charts to review price movements and identify patterns in the market
Types of stock charts available on share market apps
Before using technical indicators, it is useful to understand the common chart types available on a share market app.
Line chart
This displays the closing price of a stock over the chosen period. This is a simple way to see how the share price has moved.
Bar chart
This chart displays the open, high, low and close for the chosen period. Each bar will represent one trading period.
Candlestick chart
A candlestick chart uses individual candles to represent price movements over a selected timeframe. Each candle shows the opening, closing, highest and lowest prices.
How to read a stock chart using a share market app
Once you open a stock chart on a share market app, you can follow a few basic steps to understand the information displayed.
Select the stock
Search for the company whose share price you want to study. Open its chart section to view the available price information.
Choose a timeframe
Select the period you want to analyse. Most apps provide options such as one day, one week, one month, six months and one year. The available timeframes may vary between platforms.
Understand the price and volume
Look at the price on the vertical axis and the period on the horizontal axis. You can also look at the volume to see how many shares have been traded.
Observe price trends
See if the price of the share has generally increased, decreased, or stayed in a certain range. You can also look at previous highs and lows.
What are market indicators?What are market indicators?
Market indicators are mathematical calculations based on price, volume, and other market data. They can be used for technical analysis for trends, momentum, volatility, and volume.
Most share market apps will allow you to add indicators to stock charts. While these can help you organise your market information, they cannot guarantee future price movements.
Common market indicators to understand
Here are some indicators that beginners may come across while using a trading app.
Moving Average (MA)
This calculates the average price of a stock over a certain amount of periods. This helps to remove any short-term volatility. This will help observe the overall trend direction.
Relative Strength Index (RSI)
The Relative Strength Index (RSI) is a momentum indicator that measures the speed and magnitude of recent price changes. It moves between 0 and 100.
Moving Average Convergence Divergence (MACD)
MACD is a momentum indicator that uses moving averages to study changes in a stock's price trend and momentum. It consists of the MACD line, signal line, and histogram.
Bollinger bands
This indicator includes a moving average with upper and lower bands. These will widen and narrow depending on the volatility. When the bands widen, it generally indicates higher volatility. When they narrow, it may indicate lower volatility. The indicator can help users study price fluctuations, but it does not establish the direction of the next price movement.
Volume indicator
The volume indicator shows the number of shares traded during a particular period. It is generally displayed as vertical bars below the price chart.
Stock charts and market indicators are different ways to analyse share price movements, volume and trends. Knowing what type of charts are available, timeframes and common indicators will help you understand what information you have available on a share market app. If you want to explore these tools on a trading platform, the 5paisa Alpha app is another option to consider for accessing market-related features and reviewing stock information. Remember, these charts and indicators are based on available market data and should be used with research and understanding of the risks involved.
